Scorpion State Marine Reserve
Where and how we study the coastline
California’s coastline extends more than 850 miles (10 degrees latitude). It
encompasses a wide variety of ecosystems, habitats and species and more than 120
marine protected areas (MPAs). Subtidal rocky reefs and associated kelp forests
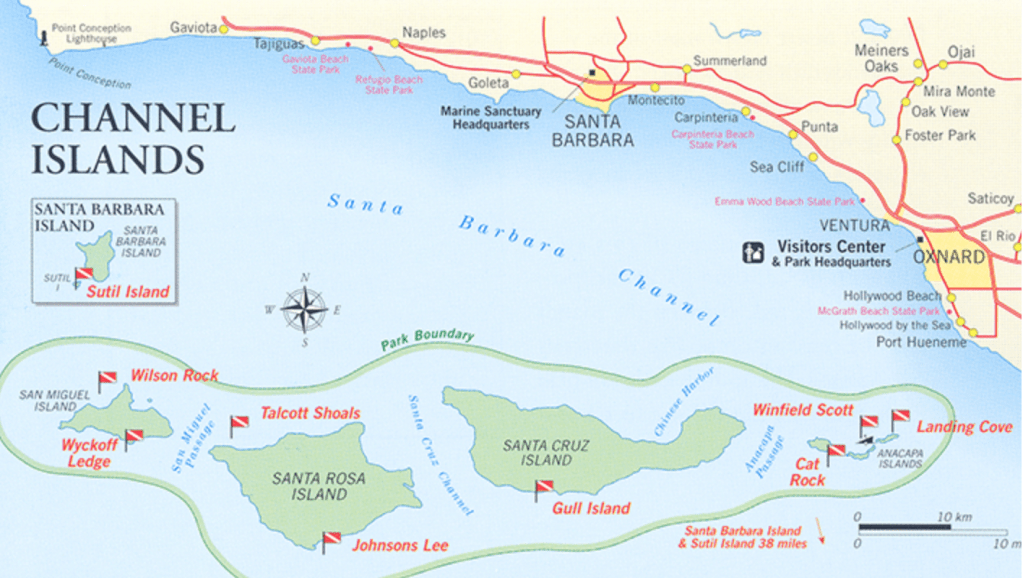
provide habitats for a wide variety of organisms. This kelp forest is located off Santa
Cruz island in the northern Channel Islands, inside the Scorpion State Marine Reserve.
While SCUBA divers can go very deep, most research divers conduct their research
from 30 – 120 feet water depth, where many rocky reefs and kelp forests occur. Divers
collect data or imagery along transects [paths of uniform distance that cut through a
natural landscape to allow for standardized observations and measurements]. For your
data research, you will be extracting data from VR imagery collected along transects
measured by time (two minutes per transect), which will allow you to measure the
density of organisms as count per minute. Your transects were conducted from 40 – 80
feet deep.
As you explore the immersive experience, capture your questions, wonderings, and
learning in a digital KLEWS chart or copy the KLEWS chart into your science notebook.

This virtual dive was recorded by James Lindholm and the research team from the
CSUMB Undersea Imagery Lab.
Santa Cruz Island (Channel Islands National Marine Sanctuary)
Transect #1 https://youtu.be/fO7FBbG7TRE
Transect #2 https://www.youtube.com/watch?v=meAShIBjdDA
Transect #3 https://www.youtube.com/watch?v=YxU9V6kgn1g
Diving Deeper with…
Data Extraction Protocol: To simulate the collection of data underwater, you will
extract your data in a 360-degree VR environment but will limit your attention to the
forward-facing hemisphere as you ‘swim’ along your transects. Note that even an expert
researcher must watch each video multiple times to be sure they have spotted all the
organisms. Watch the first clip and record anything you notice and wonder about in your
science notebook. Then rewatch the clip in groups of three: one person is the navigator,
one person is the identifier, and one person is the recorder. Work together to identify as
many examples of marine life as possible.
To help with identification and counts of organisms, you can break up the forward-facing
hemisphere into four virtual viewing quadrants – Upper Right (UR), Upper Left (UL), Lower Right (LR), and Lower Left (LL). Do your best to identify each organisms to the lowest taxonomic level possible, but understand that sometimes you will only be able to confirm ‘fish’ or ‘seastar.’ That is okay! Science underwater is never perfect.
Record your findings in your own copy of the data sheet. Compare your findings with
other groups. What were similarities in the data you recorded? What were differences in
the data you recorded?
What is information that we need to accurately record in our data sheet? What are the
limitations of vague information in the data table? What are the tradeoffs (e.g., benefits
and limitations) of entering “fish” compared to “Kelp Bass, Paralabrax clathratus ”?
Consider clarifying questions such as: What were the organisms doing? Were the fish
near kelp or reef? Were they actively swimming or” holding station” at a particular
location when you observed them? Were the fish together in groups or solitary? What
substrate was near the fish? What is the closest habitat? Where were the invertebrates?
Santa Cruz Island (Channel Islands National Marine Sanctuary)
Transect #1 https://youtu.be/fO7FBbG7TRE
Transect #2 https://www.youtube.com/watch?v=meAShIBjdDA
Transect #3 https://www.youtube.com/watch?v=YxU9V6kgn1g
Return to your KLEWS chart. Are there key words that you can now define? Consider
some of the following words: ecology, kelp forest, species, Binomial Nomenclature,
Genus, habitat, substrate, behavior, ecosystem, microhabitat, imagery, data, species
range, and latitude. Are there other words that help you to identify components of the
ecosystem?
What are the connections between organisms, populations, communities, and
ecosystems? What are the similarities and differences between California’s shallow
ocean habitats including the kelp forest, sandy substrate, and rocky substrate? What
are biotic (living) and abiotic (non-living) components of the ecosystem?
Communicating Scientific Results: “Science communication is part of a scientist’s
everyday life. Scientists must give talks, write papers and proposals, communicate with
a variety of audiences, and educate others. When scientists are able to communicate
effectively beyond their peers to broader, non-scientist audiences, it builds support for
science, promotes understanding of its wider relevance to society, and encourages
more informed decision-making at all levels, from government to communities to
individuals. It can also make science accessible to audiences that traditionally have
been excluded from the process of science. It can help make science more diverse and
inclusive.” (Feliu-Moyer, 2015). One aspect of effective communication in science is the
claim, evidence, and reasoning statement or CER. Check out the three CER prompts
below. Choose the one that interests you!
CER Option 1: Compare and contrast any two of the fish or invertebrate species based
on the data collected. You labeled these in the data sheet provided. Think about
comparing species name, substrate, appearance, habitat and behavior. Tip: make
reference to the PowerPoint ID slides showing species name and picture, if needed.
CER Option 2: Why is it important for scientists to collect, interpret, and analyze data?
In your CER include an example of a data row that was collected and explain its
importance to a scientist and data collection and analysis. Example of a data row:
8/26/2024, location: SCORPION, time of appearance mm:ss 0:04, quadrant: UL,
species: kelp bass, substrate: Water column, Habitat water Column, behavior: Active
Swimming, Observer: Group 2.
CER Option 3: Think back to when you were viewing the Immersive VR Dives and
identify a species you saw as well as the habitat it was in. Explain why this species
thrives in such an environment. You may do additional research of the species chosen
online.
More Data: Becoming a Taxonomic Expert
Deeper Protocol: Select a transect/clip of your choice and complete the protocol (note:
this can also be completed individually):
Facilitated Observation
- First observation with video clip
- Record any observations, noticings, wonderings in your science noteboo
- Pair Observation (in pairs or groups of three)
- Second observation with same video clipDiscuss in pairs/threes, what did you see, notice, and wonder?
- Recording Data Observation
- Third observation with same video clip
Analyzing Data Collected by Other Research Scientists
Conduct data analysis from existing data sets. Scientists often collect large amounts of
data on trips to interesting places, then analyze those data when they are back at their
labs. Imagery is a useful sampling tool because it creates permanent records of
environmental conditions at the time of capture. Because it has become more
accessible, scientists can now utilize 360˚ video to survey fishes. Deployed via SCUBA
diving, this creates a permanent record and allows a viewer to actually see more than a
diver underwater. This can include descriptive statistics as well as data visualization.
This can include coding in R Markdown to generate graphs or data summaries. The
data analysis can be used in preparation for a fact sheet.
Scientists collaborate to evaluate their data and determine patterns. Here are a few
possible data analysis approaches small groups or the whole class can take. Create a
table with the total count of each species they identified at their site(s). Create a bar
chart with the average count of each species across each transect or site (if groups or
the class studied multiple sites). Create an ecosystem map including counts.
